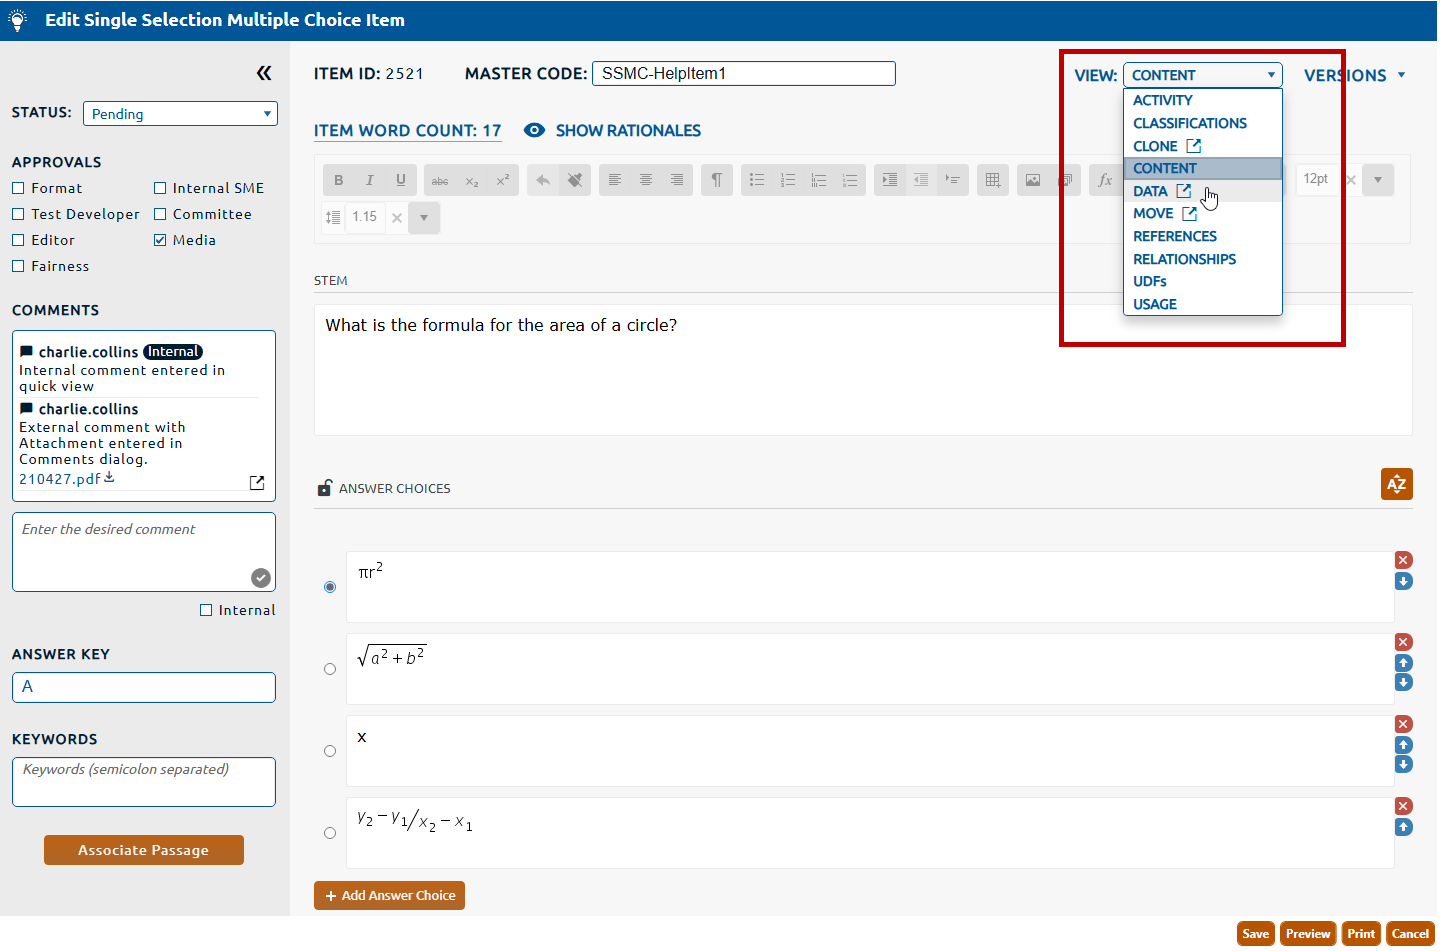
2. Select Data from the View dropdown (highlighted in red, below).
3. The Data dialog box will be displayed.
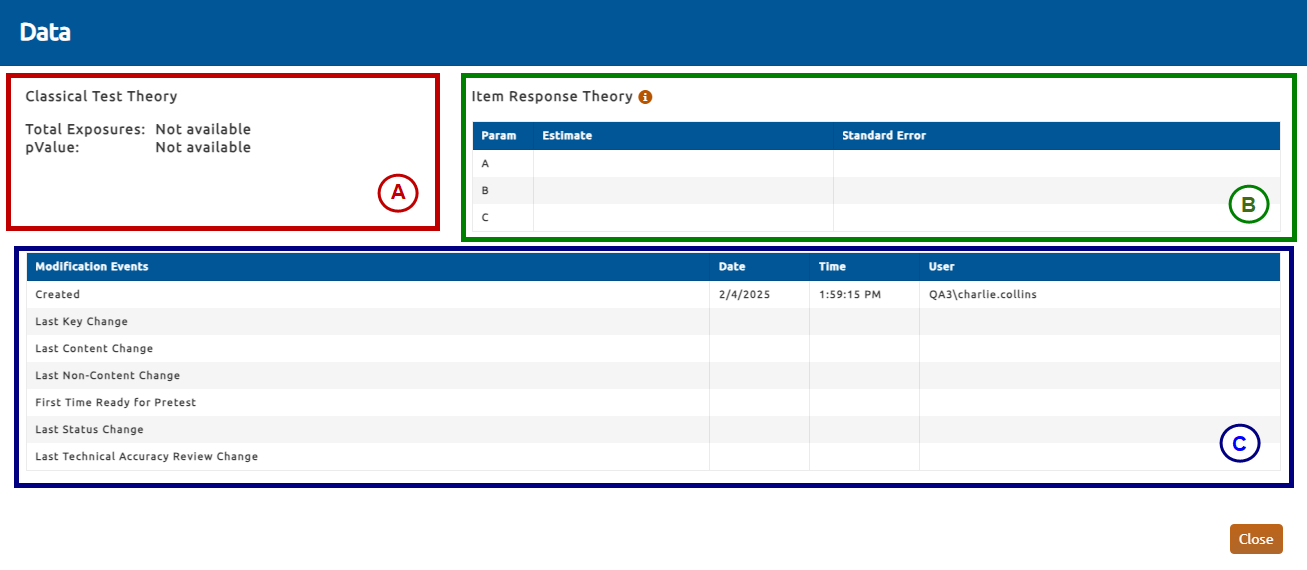
The figure above shows the Data dialog, which contains the following summary information about the item:
A. Classical Test Theory (highlighted in red, above)
Total Exposures: The number of exam takers who received a form that contained this item, regardless of whether they reached or attempted the item while taking the exam.
pValue: Proportion of exam takers who answer the item correctly, across all exposures.
B. Item Response Theory (highlighted in blue, above)
Parameters: This table shows parameters that define the shape of the probability distribution function:
A = slope of function at B.
B = identifies the 50% mark of the mass of the function.
C = establishes the floor for the distribution function.
C. Modification Events (highlighted in blue, above)
This table shows the date, time, and identity of users who performed certain critical tasks in the item's timeline.