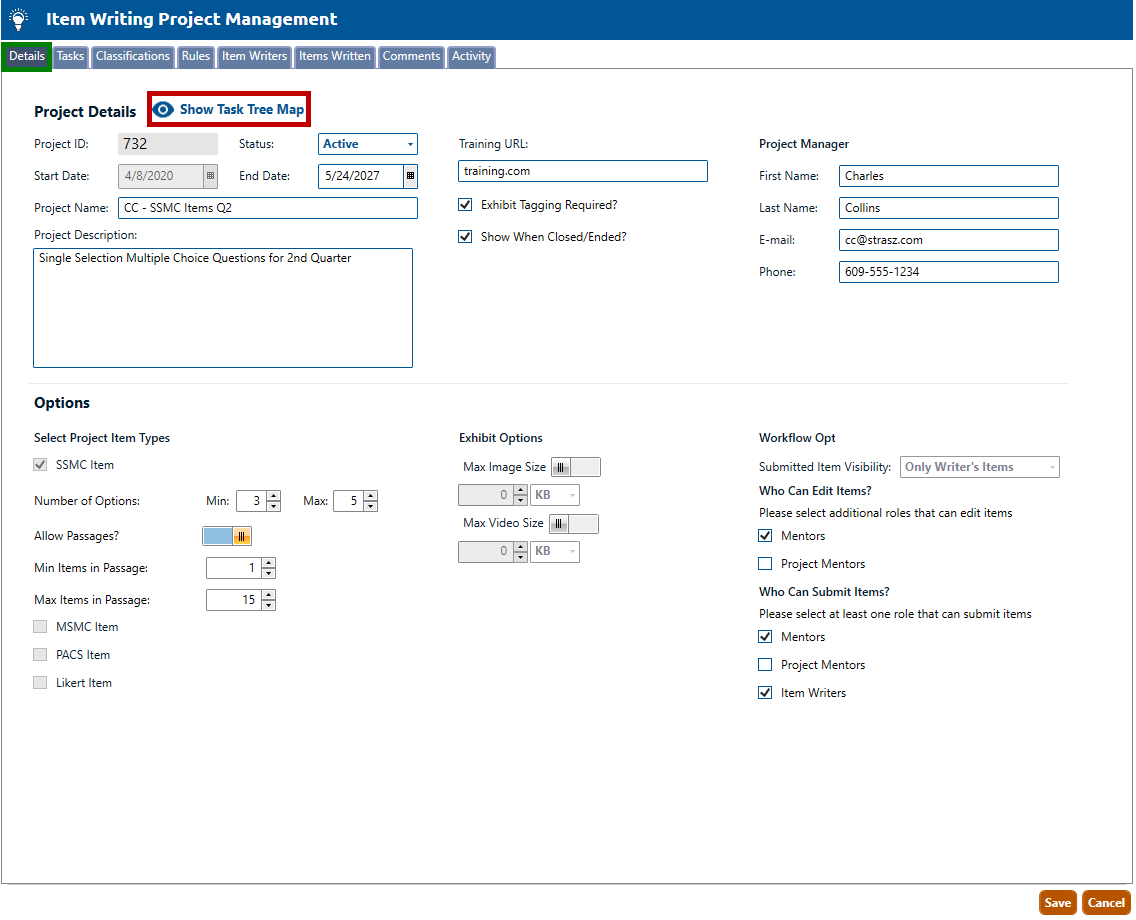
1. Navigate to the Details tab of the Item Writing Project Management screen (highlighted in green, below).
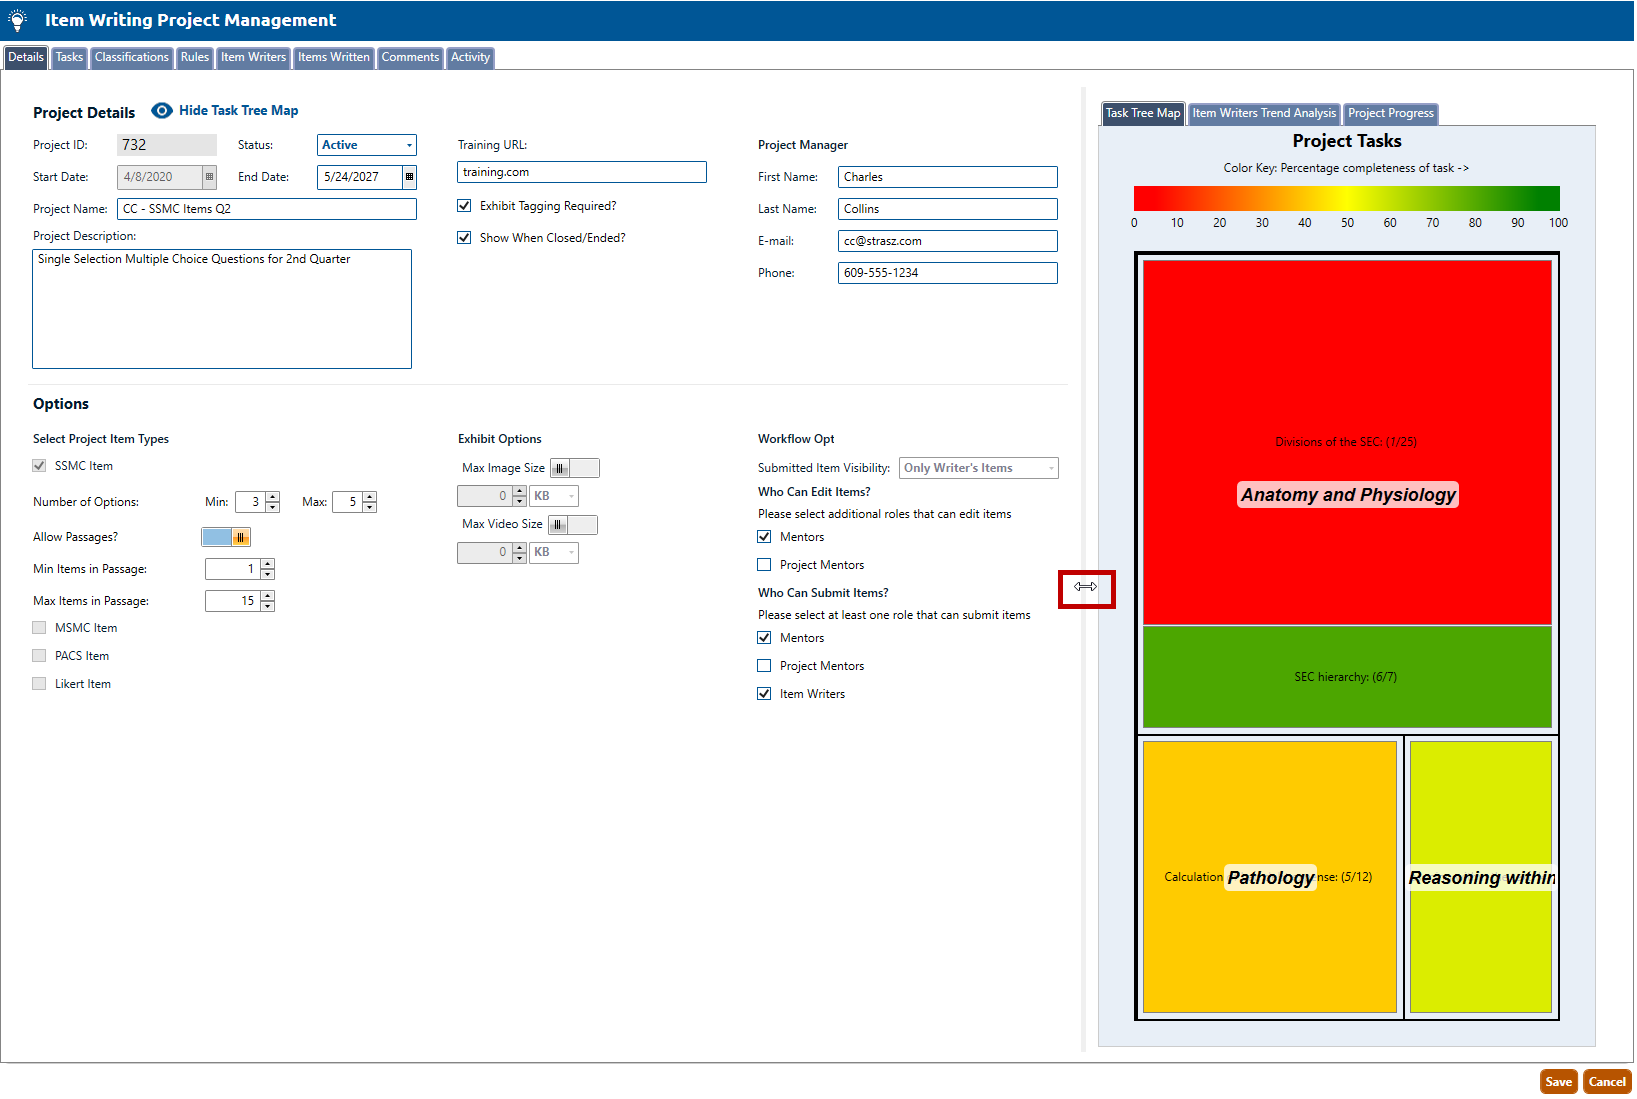
2. To view the Task Tree Map click the Show Task Tree Map icon (highlighted in red, above). The map is displayed and is resizable with the slider.
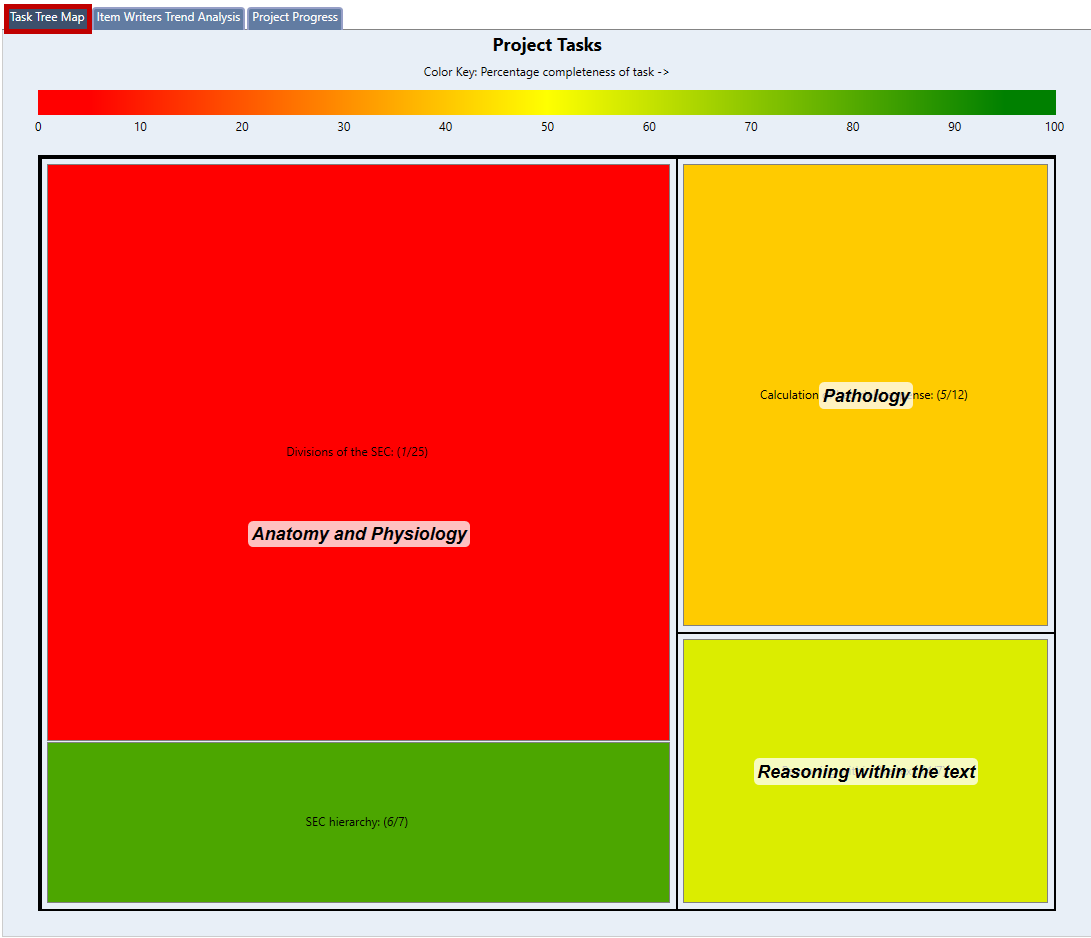
3. To view the percentage of completeness of project tasks, click the Task Tree Map tab (highlighted in red, below):
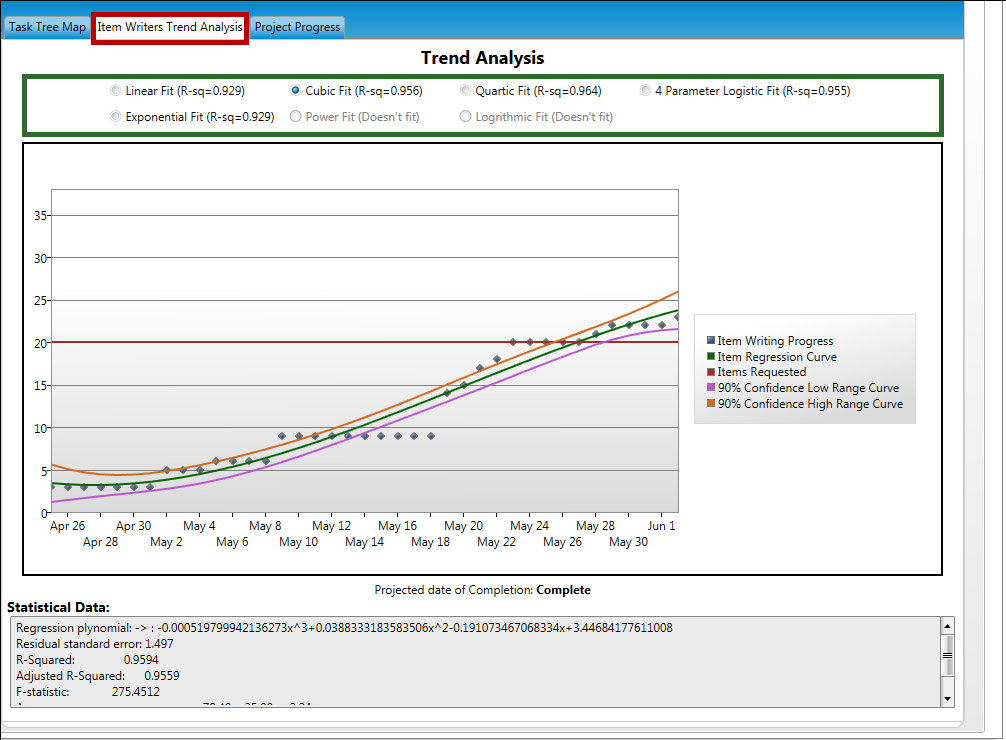
4. To view the regression based trend analysis of items written in a campaign, click the Item Writers Trend Analysis tab (highlighted in red, below), and then click the radio button of the desired trend analysis type (highlighted in green, below):
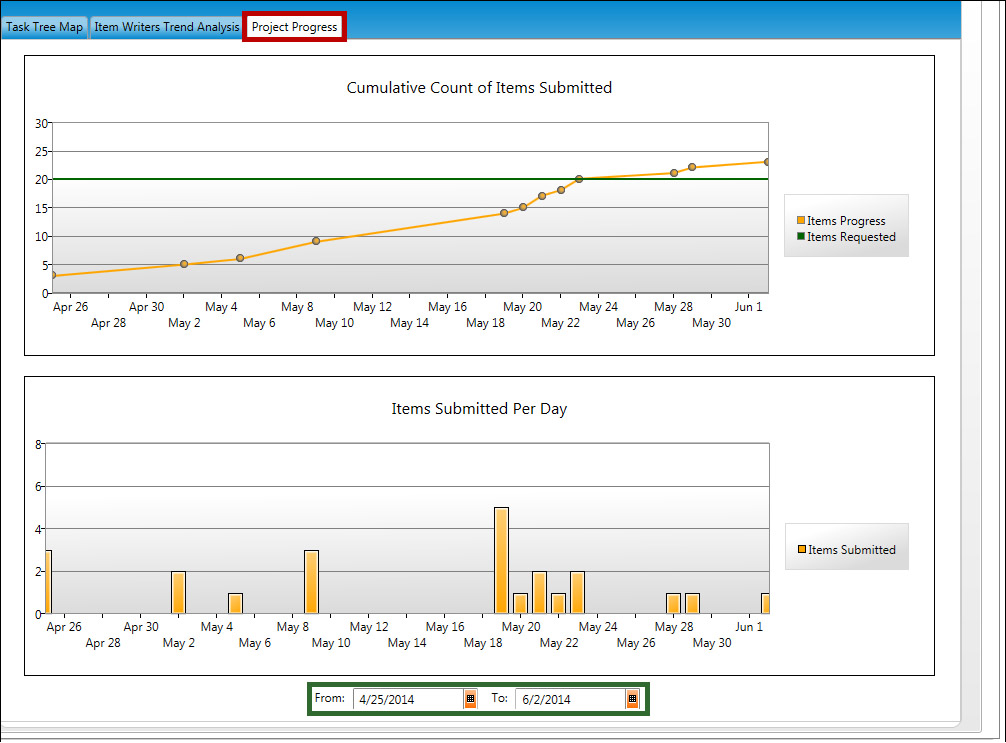
5. To view the Cumulative Count of Items Submitted, and Items Submitted Per Day, click the Project Progress tab (highlighted in red, below). For the Items Submitted Per Day graph, you may change the parameters by modifying the From and To dates (highlighted in green, below).