Creating a score report section
-
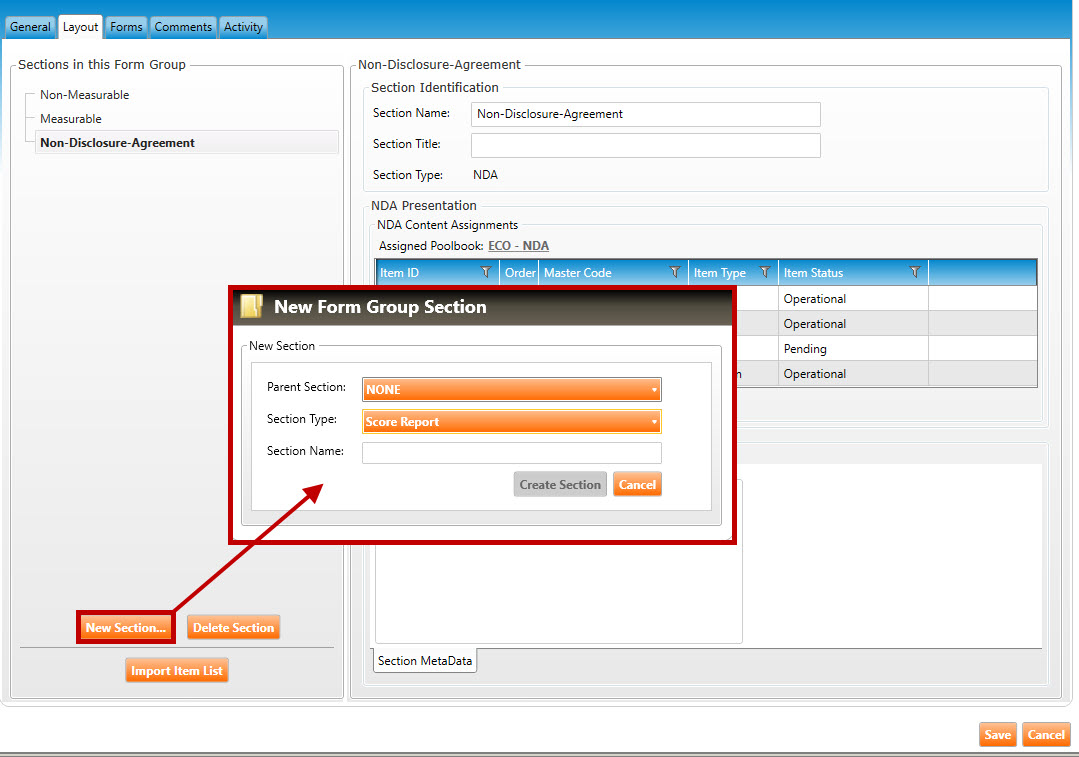
Navigate to the Layout tab (highlighted in green, below), and click the New Section button to open the New Form Group Section popup window (highlighted in red, below).
-
Select a Parent Section for this new form group, or select NONE. Selecting a parent means that this new section will become a child section within the parent section.
-
In the Section Type dropdown, select Score Report.
-
Enter a Section Name for the new section.
-
Click the Create Section button.
-
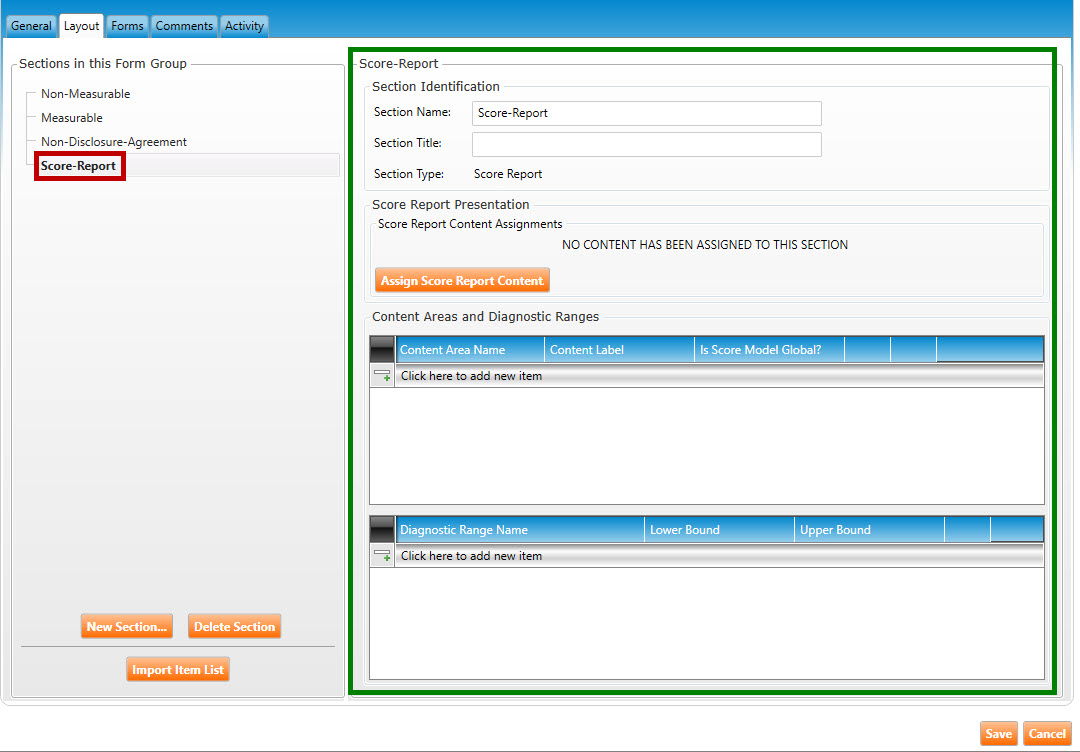
The Layout tab will populate with the new section (see figure below). The new section name (called Score_Report in the example below) is listed on the left side of the screen (highlighted in red), while the details of the section are listed on the right side (highlighted in green).
-
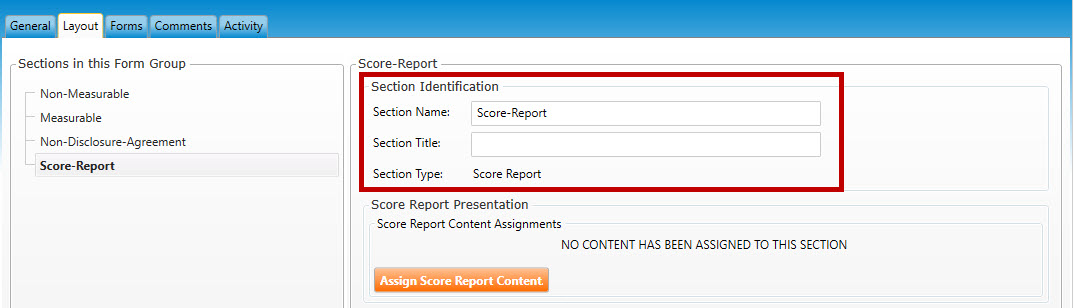
Enter the following information for Section Identification (highlighted in red, below):
-
You may edit name of the section in Section Name field.
-
Enter a Section Title for this section.
-
-
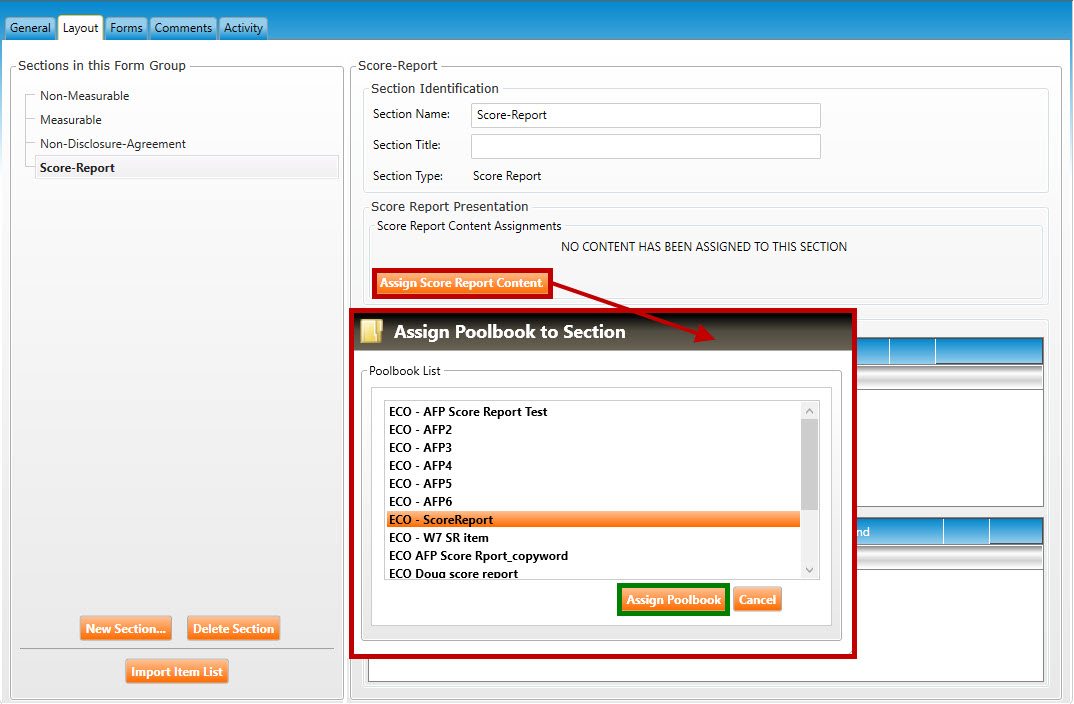
Click the Assign Score Report Content button to open the Assign Poolbook to Section pop-up window (highlighted in red, below).
-
Select a poolbook from the list, then click the Assign Poolbook button (highlighted in green, below).
-
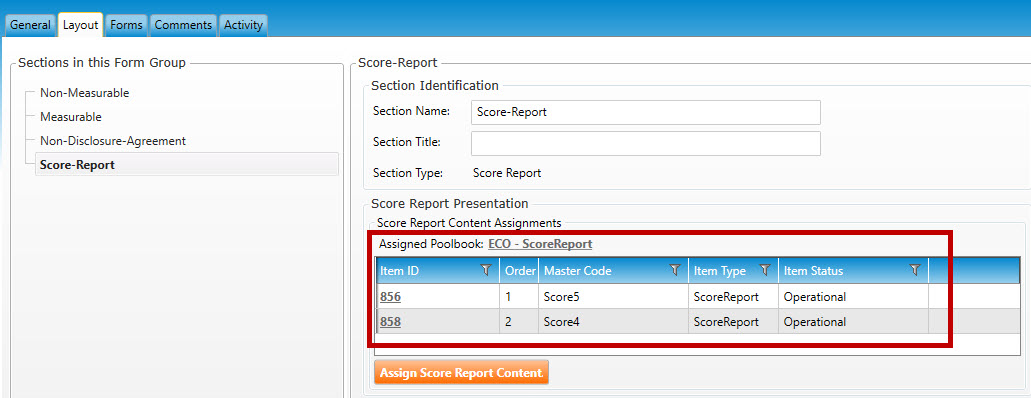
The assigned poolbook will appear in the Score Report Content Assignments (highlighted in red, below).
-
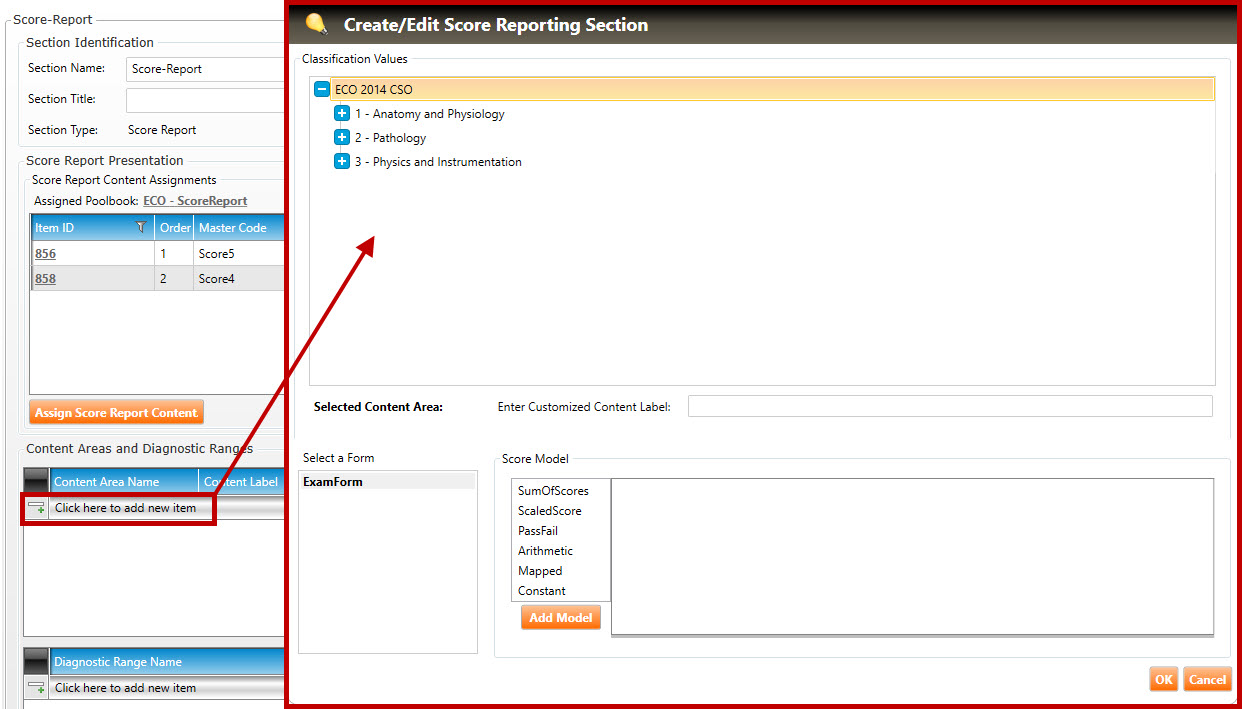
In Content Areas and Diagnostic Ranges (shown below), click the Click here to add new items button to open the Create/Edit Score Reporting Section pop-up window (highlighted in red, below):
-
Click the plus signs  (if needed) to drill down to the Enemy hierarchy level of the classification. Select an Enemy classification value by clicking it.
-
Enter a label in the Enter Customized Content Label field.
-
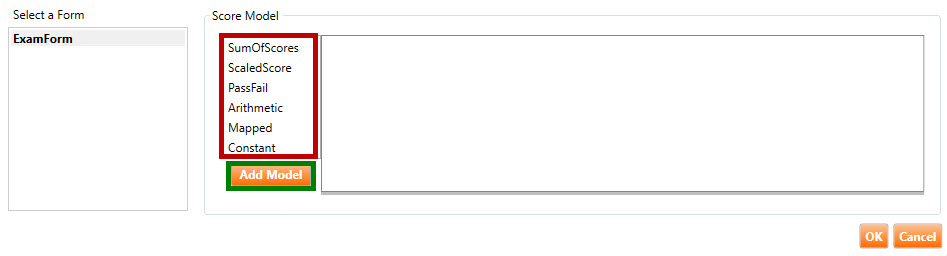
Click one of the Score Models (highlighted in red, below), and then click the Add Model button (highlighted in green, below).
-
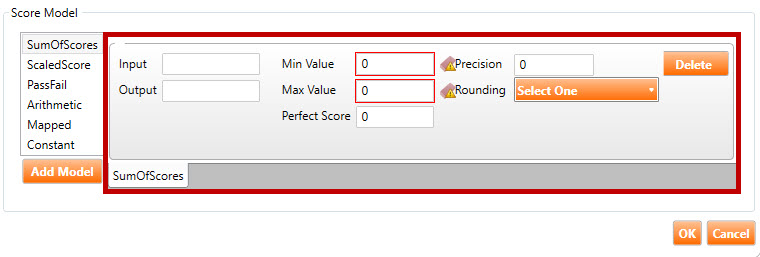
After clicking the Add Model button, the Score Model window will populate with fields relevant to the chosen Score Model. In the example below, the user has chosen SumofScores. This has populated the window with nine fields in a Sum of Scores tab (highlighted in red, below).
-
SumOfScores score model: This is the simplest type of evaluation; it is a summation of the default SCORE variable on each item within a section. The result of this summation gets written to an output variable also named SCORE. So, if there are 10 items in a test, and the candidate gets 7 of them correct, the resultant SCORE variable will have a value of 7. The following fields are found in the SumOfScores score model (shown above):
-
Input: This is an optional parameter. As stated above, the default behavior of the SumOfScores score model is to sum the value of each item’s SCORE variable. However, to have the algorithm calculate the final sum using a different variable at the item level (such as POINTS), enter the word “POINTS” in the Input field.
-
Output: To have the score model write the summation to another variable instead of SCORE, enter the name of this variable in the Output field.
-
Min Value/Max Value: As stated above, the SumOfScores score model writes the summation to a variable named SCORE. To define a boundary for the results returned, use the Min Value and Max Value attributes to define a ceiling and floor for the SCORE variable.
-
Precision: This optional parameter specifies the precision of the final SCORE value (i.e., the number of digits to the right of the decimal point). The default value is 15 decimal places. If the output turns out to be an integer, this will not apply.
-
Rounding: This optional parameter describes the rounding mode to use for the final SCORE value (e.g. ROUND_FLOOR, ROUND_DOWN, ROUND_CEILING, etc.) If the output turns out to be an integer, this will not apply.
-
ScaledScore score model: As described in the SumOfScores section (above), by default, the SumOfScores evaluation writes the sum of each item’s SCORE into a SCORE variable. Some exam authors think of this as a “Raw Score” and that the score reported to the candidate should be scaled in some manner. For example, suppose you have a section that delivers three items to the candidate. This means that the section SCORE variable might be between 0-3; however, you may like to scale this score to a 200-800 scale. Typically, this ScaledScore model will immediately follow the SumOfScores score model. This would mean that the output from the SumOfScores score model will be the input to this Scaled Score model. The result of the scaling gets written to an output variable named SCALED_VALUE.
The following fields are found in the ScaledScore score model (highlighted in red, above):
-
Input: By default, the input value (i.e., the raw score to be scaled) is in a variable named SCORE. However, to derive this input from a different variable, enter the name of this variable into the Input field. A user would typically do this if they overrode the name of the output variable in the SumOfScores score model to something other than SCORE.
-
Output: To have the score model write the scaled value to another variable instead of SCALED_VALUE, provide the name of this variable in the Output field.
-
Min Raw Score/Max Raw Score: These two parameters specify the upper and lower bound on the raw score coming in. The default values are 0 and 100.
-
Min Scale Score/Max Scale Score: These two required parameters specify the new scale (e.g., 200-800, as described above).
-
Precision: This optional parameter specifies the precision of the final scaled value (i.e., the number of digits to the right of the decimal point). The default value is 0 decimal places.
-
Rounding: This optional parameter describes the rounding mode to use for the final scaled value (e.g. ROUND_FLOOR, ROUND_DOWN, ROUND_CEILING, etc.).
-
PassFail score model: This common evaluation type defines a cut score and presents a grade of Pass or Fail based on a specified input variable. For example, suppose a section delivers 3 items and a SumOfScores evaluation is used. In addition to calculating the SCORE, the user would also like to give a grade of Pass if the candidate gets two items correct, and a Fail if they get fewer than two items correct. This type of evaluation compares a specified input variable to a cut score and determines a GRADE variable of Pass or Fail.
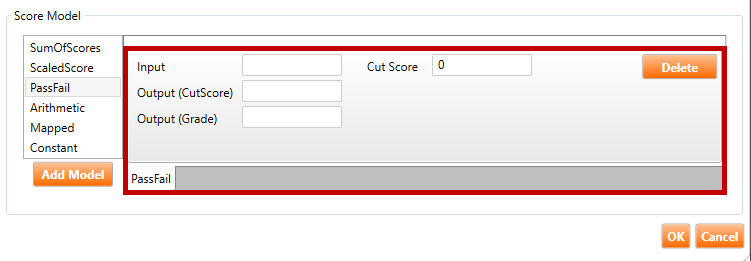
The following fields are found in the PassFail score model (highlighted in red, above):
-
Input: The name of the input variable for which to determine the grade. By default, this score model will determine the grade based on the SCORE variable. To use a different variable for the input, enter this variable name into the Input field.
-
Output (CutScore): In addition to GRADE, this score model also returns an outcome named CUTSCORE. This outcome is simply the value that the user entered in the Cut Score field. To have this outcome go to a variable other than CUTSCORE, enter the name of this variable into the Output (CutScore) field.
-
Output (Grade): To have the output of this score model (i.e., Pass/Fail) go into a variable other than GRADE, enter the name of this variable into the Output (Grade) field.
-
Cut Score: If the input variable is greater than or equal to the value input into this field, the GRADE variable is assigned a value of “Pass.” Otherwise, it is assigned a value of “Fail.”
-
Arithmetic score model: This score model is used when computations need to be performed to arrive at a candidate’s score. The meanings of the fields in this score model can best be demonstrated by an example, described below.
Let's assume the candidate took an exam with three sections, each of which has a raw score. When computing the candidate’s final raw score, assume that we want to give each of those three sections a weighted score and then sum these scores to get the final score. In this example, assume that there are three SumOfScores score models (each one calculates the raw score of one section). Each of these SumOfScore models will put the output into the variables SECTION1_SCORE, SECTION2_SCORE, and SECTION3_SCORE. The algorithm to calculate the final score is the following: Final raw score = SECTION1_SCORE + (SECTION2_SCORE * 2) + (SECTION3_SCORE * 2.5). Therefore, in order to perform this calculation, we need three arithmetic score models. Here is what these score models will have in them:
-
Arithmetic score model 1: This score model will take the SECTION2_SCORE and multiply it by 2. Its operator will be “Multiply.” It will also have two operands. The first operand will be the name of the output variable for section 2 (i.e., SECTION2_SCORE). The second operand will be the constant 2. It will put its output into a variable named SECTION2_WEIGHTED_SCORE.
-
Arithmetic score model 2: This score model will take the SECTION3_SCORE and multiply it by 2.5. Its operator will be “Multiply.” It will also have two operands. The first operand will be the name of the output variable for section 3 (i.e., SECTION3_SCORE). The second operand will be the constant 2.5. It will put its output into a variable named SECTION3_WEIGHTED_SCORE.
-
Arithmetic score model 3: This score model will take all three weighted scores and add them together. Its operator will be “Add.” It will also have the following three operands: SECTION1_SCORE, SECTION2_WEIGHTED_SCORE, and SECTION3_WEIGHTED_SCORE.
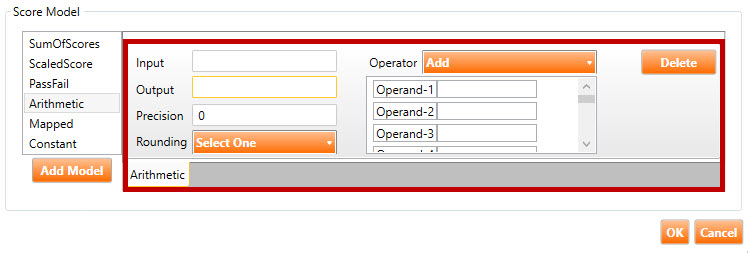
Given the above example, the following fields are found in the Arithmetic score model (highlighted in red, above):
-
Output: The name of the variable into which the result of the calculation will go.
-
Precision: This optional parameter provides a means of specifying the number of decimal places to carry in the computations. If its value is 0, all computations will be done using integers.
-
Rounding: This optional parameter indicates how the test driver should round the result of the operation (e.g., ROUND_FLOOR, ROUND_DOWN, ROUND_CEILING, etc.)
-
Operator: The mathematical operator that will be used across all operands (i.e., Add, Subtract, Multiply, etc.).
-
Operand-1, Operand-2, etc.: The list of operands on which to perform the calculation. These can be an assorted list of variables and constants.
-
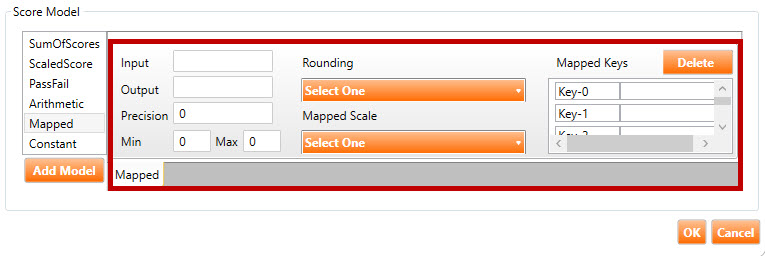
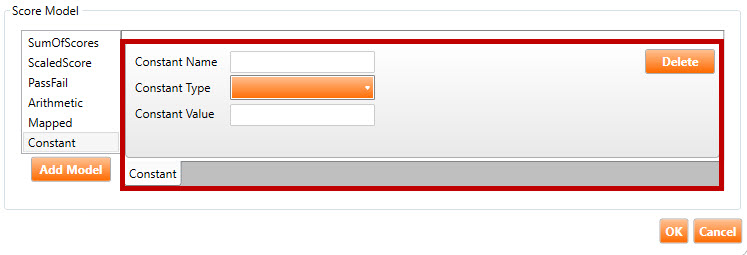
Mapped score model: This score model is used to set up a table to map a value to another value via a look-up table. The content of the look-up table is defined via the Mapped Keys fields. Moreover, the value of the Mapped Scale field dictates the algorithm that drives how the look-up will happen. For example, the look-up mode could be Nominal, Interpolative, Contiguous, etc.
The following fields are found in the Mapped score model (highlighted in red, above):
-
Input: The name of the variable that contains the value to be mapped.
-
Output: This score model will always return the mapped value in an output variable named MAPPED_VALUE. To have this output go into a different variable, enter the variable name into the Output field.
-
Precision: This optional parameter indicates how many decimal places the end result should have.
-
Rounding: This optional parameter indicates how the test driver should round the result of the operation (e.g., ROUND_FLOOR, ROUND_DOWN, ROUND_CEILING, etc.).
-
Mapped Scale: This parameter indicates which specific algorithm should be used when performing the look-up (e.g., Nominal, Contiguous, etc.).
-
Mapped Keys: This table defines the look-up table that will be used to map the value of the input to an output value. Each row in this table contains two text boxes. The first text box contains the look-up key, and the second column contains the resultant value.
J. When the Pearson score report gets printed, there is often a diagnostic section in the report. This diagnostic section is a table that illustrates how the candidate performed in each of the individual diagnostic areas. Here is an example of how one of these diagnostic sections may look:
|
|
Area
|
Score
|
Performance
|
|
|
Algebra
|
5
|
Poor
|
|
|
Geometry
|
9
|
Satisfactory
|
|
|
Arithmetic
|
16
|
Good
|
***Update table
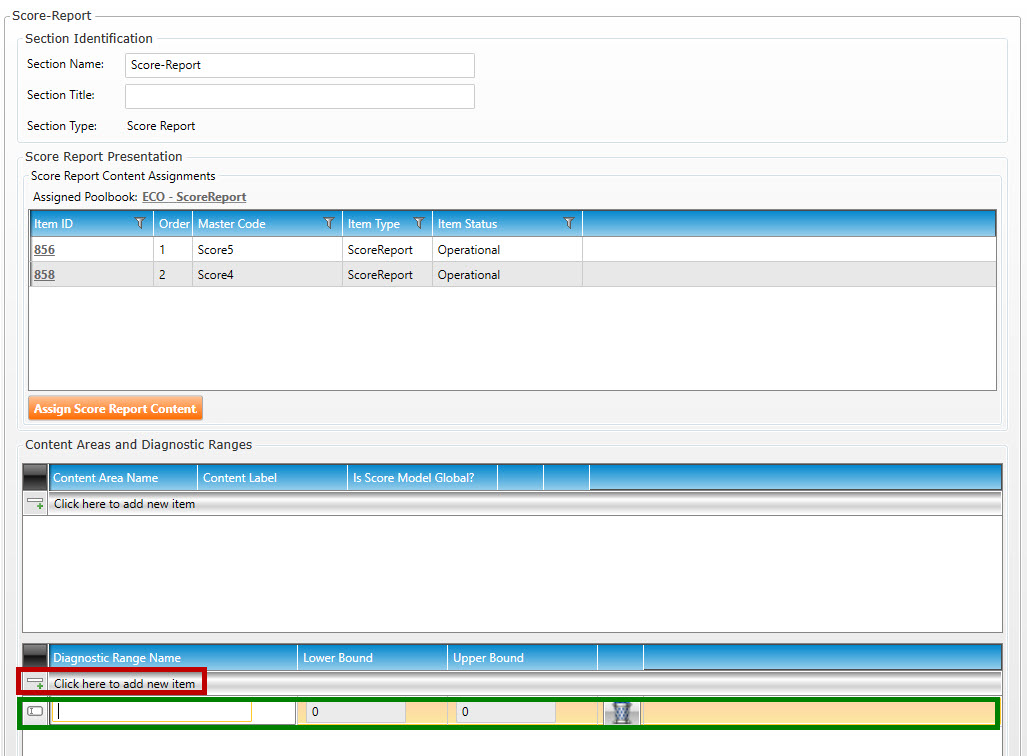
In Diagnostic Name Range (shown below), click the Click here to add new item button (highlighted in red, below) to add a blank Diagnostic Range Name entry (highlighted in green, below):
The purpose of each row added above is to allow the user to enter the various ranges (Lower Bound and Upper Bound) to categorize performance. If we use the above sample diagnostic section as an example, assume that the performances are mapped to the following ranges of number correct:
-
-
7 to 11 correct = Satisfactory
-
-
17 to 20 Correct = Excellent
In order to save the above diagnostic ranges, the user would need to enter four rows into the table that represent the ranges. So, for the “Poor” diagnostic range, the user would add a new row to the table and enter the following values into the fields:
Diagnostic Range Name: Poor
Lower Bound: 0
Upper Bound: 6
K. Click the Save button to save all changes.